Scholarly Analysis of TBL
Supporting Data
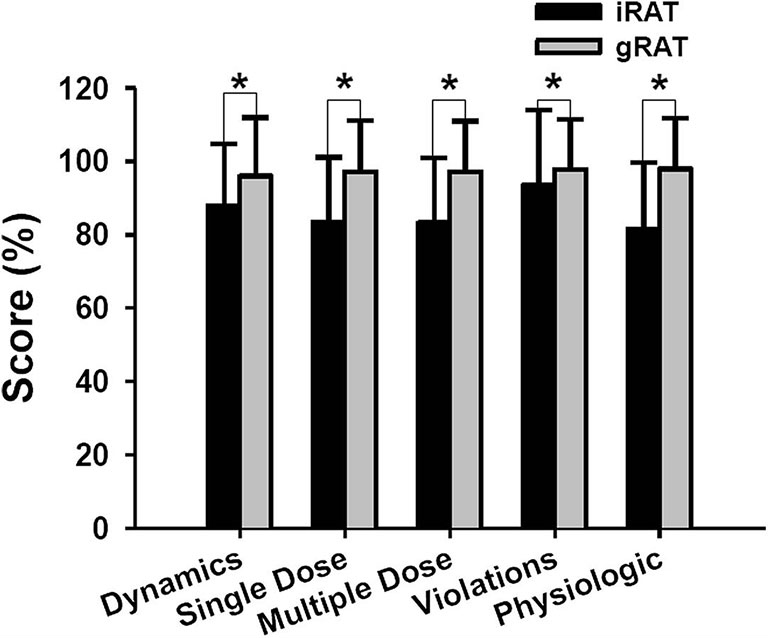
There was significant improvement in the team scores for each module. The iRAT scores averaged over 80% for any given module (median 83%, average 86%, range 82%- 94%), whereas the gRAT scores averaged over 95% for any given module (median 97%, mean 97%, range 96%-98%)3
Figure 1. Comparison of individual and team quizzes from the readiness-assessment process. Data presented as mean and standard deviations. Abbreviations: iRAT = individual quiz; gRAT = team quiz. * p < 0.001.
Mean percentage change in scores was greater in the TBL versus the control group in post-test 1 (8.8% vs 4.3%, p = 0.023) and post-test 2 (11.4% vs 3.4%, p = 0.001). After adjustment for gender and second year examination grades, mean percentage change in scores remained greater in the TBL versus the control group for post-test 1 (10.3% vs 5.8%, mean difference 4.5%,95% CI 0.7 - 8.3%, p = 0.021) and post-test 2 (13.0% vs 4.9%, mean difference 8.1%,95% CI 3.7 - 12.5%, p = 0.001), indicating further score improvement 48 hours post-TBL.5
Figure 2
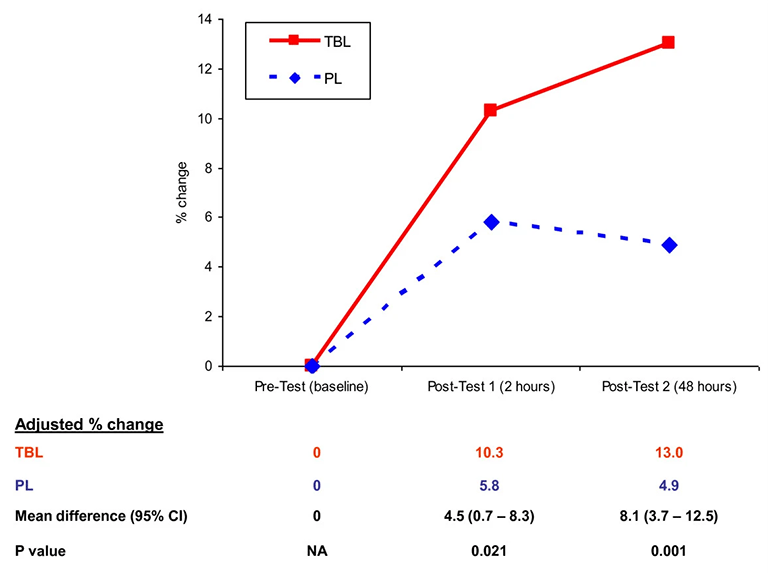
Mean percentage change in test scores, adjusted for gender and second year examination grades.
Figure 3
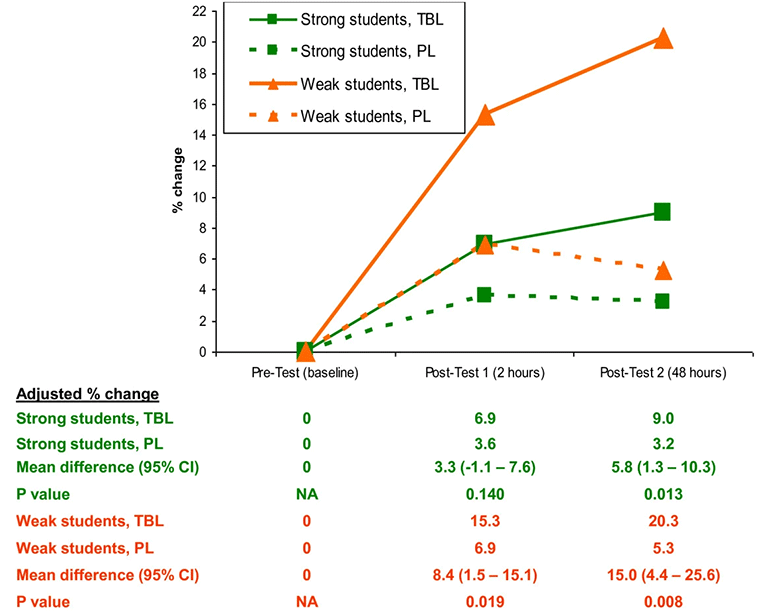
Adjusted mean percentage change in test scores, strong vs weak students.
The 178 students (86 men, 92 women) included in the study achieved 5.9% (standard deviation [SD] 5.5) higher mean scores on examination questions that assessed their knowledge of pathology-based content learned using the TBL strategy compared with questions assessing pathology-based content learned via other methods (P < .001, t test). Students whose overall academic performance placed them in the lowest quartile of the class benefited more from TBL than did those in the highest quartile. Lowest-quartile students' mean scores were 7.9% (SD 6.0) higher on examination questions related to TBL modules than examination questions not related to TBL modules, whereas highest-quartile students' mean scores were 3.8% (SD 5.4) higher (P = .001, two-way analysis of variance).6
References
1Ofstad,W and Brunner, L; “Team-Based Learning in Pharmacy Education,” American Journal of Pharmaceutical Education, May 13, 2013, v 77(4).
2Attia, R and Mandoor, A,”Team-based learning-adopted strategy in pharmacy education: pharmacology and medicinal chemistry students’ perceptions,” Future Journal of Pharmaceutical Science, Feb 23, 2023, v 9(1).
3Persky, A. M. (2012), “The impact of team-based learning on a foundational pharmacokinetics course,” American Journal of Pharmaceutical Education, 76(2), 31.
4Letassy, N. A., Fugate, S. E., Medina, M. S., Stroup, J. S., & Britton, M. L. (2008). “Using team-based learning in an endocrine module taught across two campuses,” American Journal of Pharmaceutical Education, v.72(5); Oct 15, 2008.
5Tan, N. C., Kandiah, N., Chan, Y. H., Umapathi, T., Lee, S. H., & Tan, K. (2011), “ A controlled study of team-based learning for undergraduate clinical neurology education,” BMC Medical Education, 11, 91. 72(5).
6Koles, P. G., Stolfi, A., Borges, N. J., Nelson, S., & Parmelee, D. X. (2010), “The impact of team-based learning on medical students' academic performance,” Academic Medicine, 85(11), 1739-1745.

